CORAL (MBR2)#

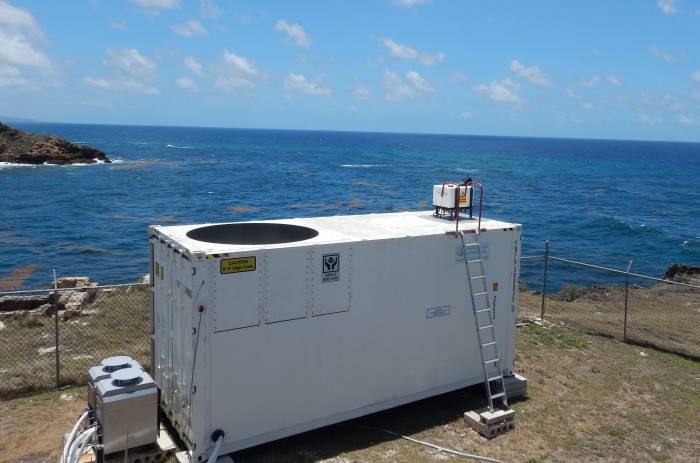
The polarised 35.5 GHz Doppler radar is part of the Combined Radar And Lidar instrument (CORAL) at the Barbados Cloud Observatory (BCO). It has a sensitivity of -48 dBZ at an altitude of 5 km and -70 dBZ at an altitude of 500 m. The radar has a range gating of 31.18 m and measures at ranges between 150 m and 18.9 km. It operates in a zenith looking mode, so that range gating effectively measures distance in the vertical. To measure the vertical velocity the radar uses the Doppler technique with an FFT of 256 samples, giving it a Doppler resolution of < 0.02 m s-1 between -10 and 10 m s-1. The radar is able to provide the linear depolarisation ratio (LDR), which can be used for a target classification based on their shape. Data processing and radar calibration are done by following [Görsdorf et al., 2015], which leads to an uncertainty of 1.3 dB.
Configurations#
The radar has been operated in slightly different configurations over time, the different available configurations are listed here:
dataset |
timestep |
range |
start date |
end date |
|---|---|---|---|---|
|
10s |
155m-14km |
2015-06-05 |
2016-06-01 |
|
10s |
155m-25km |
2016-06-02 |
2018-04-18 |
|
10s |
155m-18km |
2018-04-19 |
2018-04-29 |
|
2s |
155m-18km |
2018-04-30 |
today |
Work in Progress
The dataset BCO.radar_MBR2_c2_v1 is currently not available due to a processing error.
Examples#
La Soufrière Eruption in April 2021#
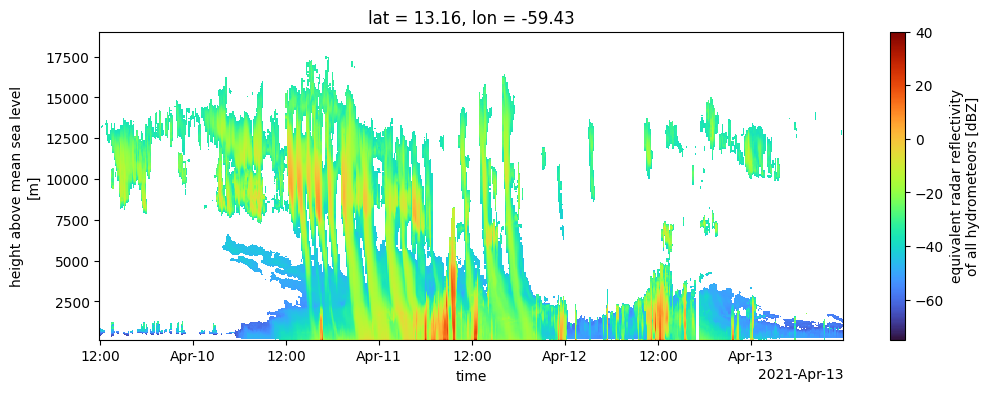
The La Soufrière Eruption started on 9 April 2021 at 12:41 UTC. The dispersion and aging of the emitted volcanic aerosols have been investigated by [Bruckert et al., 2023], where data from the MBR2 radar has been used. We’ll show how to recreate a similar plot to the radar plot from Figure 2 of that publication:
import intake
import numpy as np

# this is the time-period investigated in the paper
simulation_start = np.datetime64("2021-04-09T12:00")
simulation_end = simulation_start + np.timedelta64(96, "h")

# get an appropriate radar dataset from tcodata
cat = intake.open_catalog("https://tcodata.mpimet.mpg.de/catalog.yaml")
mbr2 = cat.BCO.radar_MBR2_c4_v1.to_dask()

# cut, resample and plot the data
reflectivity_in_simulation_period = mbr2.Ze.sel(time=slice(simulation_start, simulation_end))
reflectivity_10min_avg = reflectivity_in_simulation_period.resample(time="10min").mean()
reflectivity_10min_avg.plot(x="time", y="alt", vmin=-75, vmax=40, figsize=(12, 4), cmap="turbo");
/opt/conda/lib/python3.12/site-packages/intake_xarray/base.py:21: FutureWarning: The return type of `Dataset.dims` will be changed to return a set of dimension names in future, in order to be more consistent with `DataArray.dims`. To access a mapping from dimension names to lengths, please use `Dataset.sizes`.
  'dims': dict(self._ds.dims),

Note
The dataset we used for the plot comes with 2 seconds temporal sampling, which can be a lot of data. For this example, we resampled this to 10 minutes, because otherwise plotting would take much longer.